
"If your experiment succeeds, how will you know it actually moved the business?" An Uber interviewer once asked me.
Why most experiments fail and how choosing the right metrics can turn data into real decisions.

Welcome to the DATA SCIENCE EXPERIMENTS SERIES
Previously we discussed,
Day 1: Design of an experiment https://weeklydatascience.substack.com/p/uber-interviewer-askedhow-do-you
Day 2: Hypothesis
https://weeklydatascience.substack.com/p/uber-interviewer-asked-me-one-question
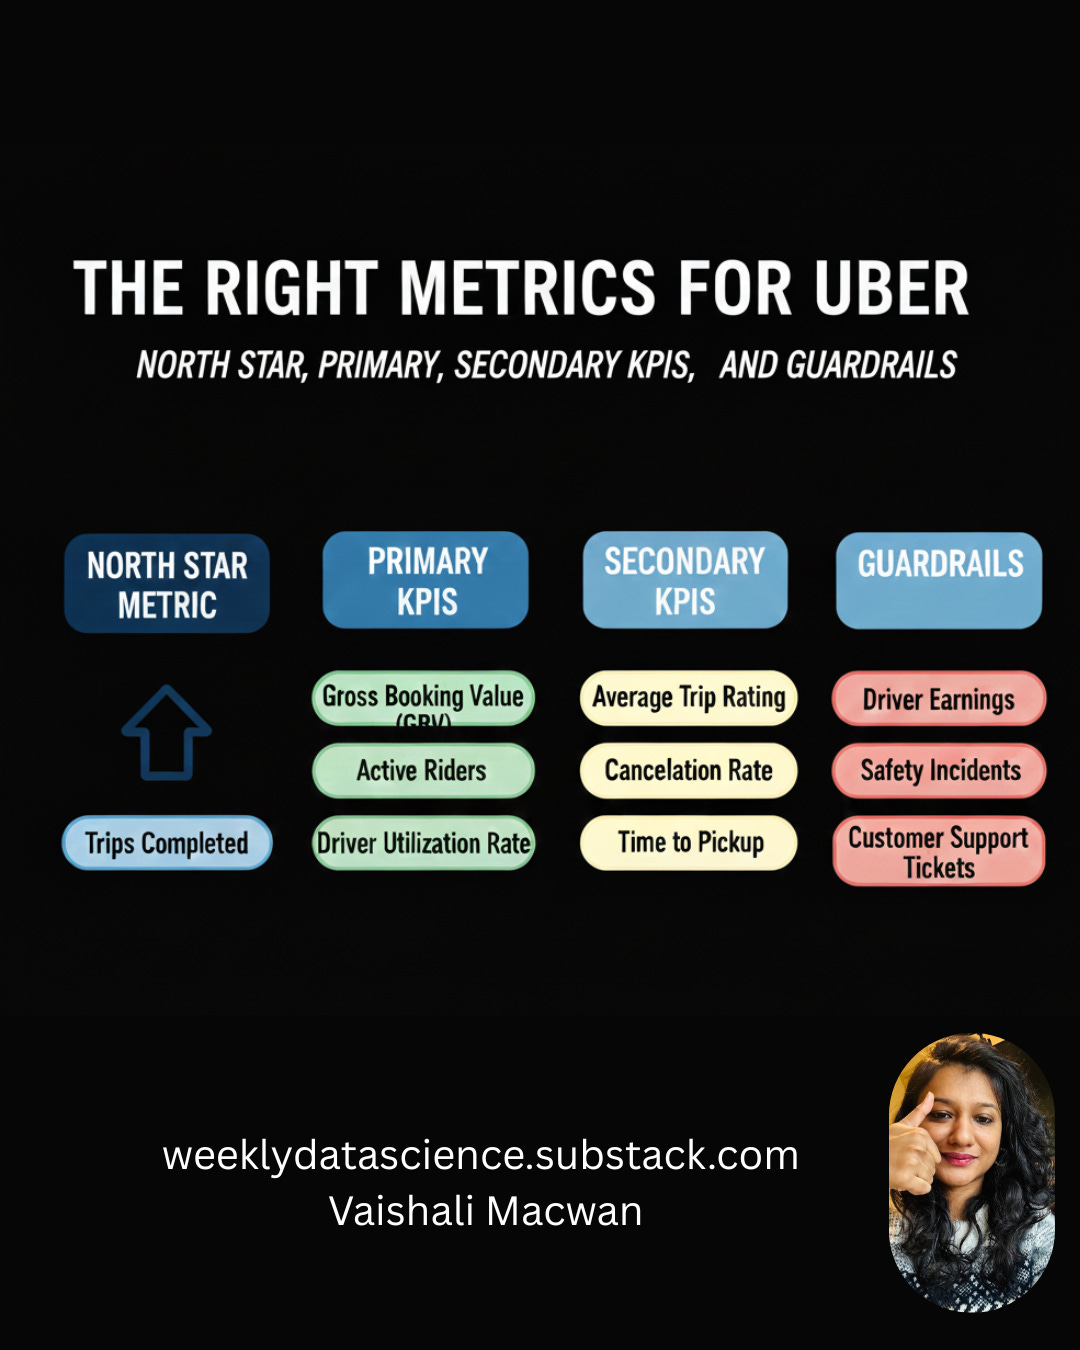
Welcome to Day 3: Choosing the Right Metrics (North Star, Primary KPIs, Secondary KPIs, and Guardrails)
You’ve crafted a bulletproof hypothesis. Now comes the hardest part: choosing what to measure.
Here’s what I see go wrong constantly:
A team runs an experiment, the primary metric improves by 15%, everyone celebrates, they ship the feature... and three months later, revenue is down, users are churning, and no one knows why.
What happened?
They optimized the wrong thing. They moved a metric without understanding the system.
Today, we’ll fix that.
The Metric Hierarchy
Not all metrics are created equal. Think of them as a pyramid:
Level 1: North Star Metric (The ultimate goal)
Level 2: Primary KPI (What you’re directly optimizing)
Level 3: Secondary KPIs (Context and supporting evidence)
Level 4: Guardrail Metrics (What you’re protecting)
Get this hierarchy wrong, and you’ll win battles while losing the war.
Level 1: North Star Metric
Definition: The ONE metric that best captures the core value your product delivers to customers and your business.
Purpose: Keeps everyone aligned on what actually matters. When in doubt, optimize for this.
Characteristics:
Measures value delivered, not vanity
Leads to revenue (directly or indirectly)
Reflects customer success
Hard to game
Moves slowly (quarterly, not daily)
Examples:
Uber: Completed rides per week
Netflix: Hours of content watched per subscriber
Airbnb: Nights booked
Slack: Messages sent by paying teams
Amazon: Purchases per customer per year
Why it matters:
Your North Star keeps you honest. You might run 100 experiments optimizing different things, but they should ALL ultimately move the North Star.
If your experiment improves a primary KPI but hurts the North Star, the experiment failed. Period.
How to choose your North Star:
Ask yourself: “If this metric grows, are customers getting more value AND is our business healthier?”
If the answer is yes to both, you’ve found it.
Level 2: Primary KPI
Definition: The specific metric your experiment is designed to move. This is directly tied to your hypothesis.
Purpose: Clear success criteria for THIS experiment.
Characteristics:
Directly measures hypothesis outcome
Changes quickly (daily/weekly)
Specific to the experiment
Easy to measure accurately
One primary KPI per experiment
Why ONE primary KPI?
Multiple primary KPIs create confusion. If KPI A improves but KPI B declines, did you succeed? You can’t serve two masters.
Pick the one that matters most for THIS experiment.
How Primary KPI connects to North Star:
Think of it as a stepping stone:
North Star: Completed rides per week
Primary KPI: Booking conversion rate
Logic: More bookings → More completed rides
If your Primary KPI improves but North Star doesn’t, you’ve found a broken assumption. Maybe bookings increased but cancellations also increased. That’s valuable learning.
Level 3: Secondary KPIs
Definition: Supporting metrics that provide context and help you understand HOW and WHY the primary KPI moved.
Purpose:
Validate the primary result
Reveal unintended consequences
Explain the mechanism
Guide iteration
Characteristics:
Multiple are fine (3-7 typically)
Provide diagnostic insights
May move in unexpected ways
Help interpret primary KPI changes
Types of Secondary KPIs:
1. Leading Indicators Metrics that change BEFORE the primary KPI
Click-through rate (leads to conversion)
Time on page (leads to engagement)
Feature discovery (leads to adoption)
2. Mechanism Validators Prove WHY your hypothesis worked
If hypothesis: “X reduces friction”
Measure: Time to complete action
3. Segment Analysis How different user groups respond
New vs returning users
Mobile vs desktop
Geographic regions
User cohorts
4. Quality Metrics Ensure you’re not winning by degrading quality
Error rates
Load times
Customer satisfaction scores
Level 4: Guardrail Metrics
Definition: Metrics you’re NOT trying to improve but must NOT harm. Your safety nets.
Purpose: Prevent optimization disasters. Protect the ecosystem.
Characteristics:
Set threshold boundaries (can’t drop more than X%)
Different from Secondary KPIs (you EXPECT secondary KPIs to move, you HOPE guardrails stay flat)
Experiment fails if guardrails are breached, regardless of primary KPI success
Common Guardrail Categories:
1. Revenue Protection
Revenue per user
Average order value
Lifetime value
2. User Experience
Page load time
Error rates
Crash rates
Support ticket volume
3. Trust & Safety
Fraud rate
Policy violations
User reports/complaints
4. Ecosystem Health (for marketplaces)
Supply-side metrics (driver/seller satisfaction)
Balance metrics (supply-demand ratio)
5. Long-term Health
Churn rate
Account deletions
Negative reviews
How to set guardrail thresholds:
Not “stays exactly the same” (too strict, nothing ships)
Instead: “Can’t drop more than X%”
Example:
Revenue per user can’t drop more than 2%
Error rate can’t increase more than 0.5%
NPS can’t decline more than 3 points
Uber Case Study: Upfront Pricing Metrics
Let’s map out the complete metric hierarchy for our upfront pricing experiment.
The Setup: We’re testing exact upfront fare ($15.20) vs price range ($12-$18)
North Star Metric: Completed Rides per Week
Why this North Star?
Captures core value (people using Uber to get places)
Correlates with revenue (more rides = more money)
Measures customer success (people achieving their transportation goals)
Hard to game (fake rides get caught)
Primary KPI: Booking Conversion Rate
Definition: % of users who see a price quote and confirm the ride
Current baseline: 65%
Target: 73%
Why this KPI?
Directly tests our hypothesis
Measurable in real-time
Clear success threshold
Moves quickly (can measure daily)
Calculation:
Booking Conversion Rate = (Rides Booked / Price Quotes Shown) × 100Secondary KPIs (with reasoning):
1. Time to Book
Measures: Seconds from price display to booking confirmation
Why: Tests our “reduces decision friction” mechanism
Expected: Should DECREASE if hypothesis is correct
Baseline: 8.5 seconds
What it tells us: If conversion improves but time-to-book stays same, friction reduction isn’t the mechanism
2. Average Fare per Ride
Measures: Mean dollar amount per completed ride
Why: Exact prices might look higher/lower than ranges, affecting user selection
Expected: Should stay roughly flat
Baseline: $15.80
What it tells us: If fare drops significantly, we might be attracting only low-value rides
3. User Satisfaction Score (Post-Ride Survey)
Measures: 5-point rating on “Price was fair”
Why: Validates users prefer exact pricing psychologically
Expected: Should INCREASE
Baseline: 4.1/5
What it tells us: If conversion improves but satisfaction drops, we’re forcing reluctant bookings
4. Repeat Usage within 7 Days
Measures: % of users who book again within a week
Why: Shows if feature creates sticky behavior
Expected: Should INCREASE or stay flat
Baseline: 38%
What it tells us: If one-time bookings increase but repeats drop, we’re not building habit
5. Price Quote Request Rate
Measures: How often users request price quotes
Why: Shows if exact pricing makes users more/less likely to check prices
Expected: Might increase (less anxiety) or decrease (more decisive)
Baseline: 2.3 quotes per booking
What it tells us: User confidence and decision-making patterns
Guardrail Metrics (with thresholds):
1. Driver Acceptance Rate
Definition: % of ride requests accepted by drivers
Current: 92%
Threshold: Cannot drop below 90%
Why: If exact prices seem too low to drivers, they reject rides, breaking the marketplace
Failure mode: Riders book but can’t find drivers
2. Rider Cancellation Rate
Definition: % of booked rides canceled by riders before pickup
Current: 5%
Threshold: Cannot rise above 7%
Why: If exact prices cause sticker shock after booking, cancellations spike
Failure mode: Drivers waste time on canceled rides
3. Driver Cancellation Rate
Definition: % of accepted rides canceled by drivers
Current: 3%
Threshold: Cannot rise above 4%
Why: Drivers might cancel after seeing full trip details if fare seems unfair
Failure mode: Riders stranded after booking
4. App Performance Metrics
Page load time: Cannot exceed 1.2 seconds (current: 0.8s)
Error rate: Cannot exceed 0.5% (current: 0.2%)
Crash rate: Cannot exceed 0.1% (current: 0.05%)
Why: New pricing calculation might slow down the app
Failure mode: Users abandon due to technical issues
5. Revenue per Completed Ride
Current: $3.50 (Uber’s take)
Threshold: Cannot drop below $3.30 (5.7% decrease)
Why: Exact pricing might compress margins
Failure mode: More rides but less profitable
6. Support Ticket Volume
Current: 2.1 tickets per 1000 rides related to pricing confusion
Threshold: Cannot rise above 2.5
Why: Should reduce confusion, not increase it
Failure mode: New UI creates different confusion
The Decision Matrix
Here’s how you use all these metrics together:
Scenario 1: Clear Win
Primary KPI: ✅ Hits target (73%)
Secondary KPIs: ✅ Move as expected (time-to-book down, satisfaction up)
Guardrails: ✅ All within thresholds
Decision: Ship it to 100%
Scenario 2: Partial Win
Primary KPI: ✅ Hits target (73%)
Secondary KPIs: ⚠️ Mixed (satisfaction up, but repeat usage flat)
Guardrails: ✅ All within thresholds
Decision: Ship it, but investigate why repeats didn’t improve
Scenario 3: Primary Win, Guardrail Breach
Primary KPI: ✅ Hits target (73%)
Secondary KPIs: ✅ Looking good
Guardrails: ❌ Driver acceptance dropped to 88%
Decision: Do NOT ship. Fix the driver acceptance issue first.
This is why guardrails exist. You “won” the primary KPI but broke the marketplace.
Scenario 4: Primary Miss, Unexpected Secondary Win
Primary KPI: ❌ Only reached 68% (missed target)
Secondary KPIs: ✅ Satisfaction jumped to 4.6, repeat usage up 8%
Guardrails: ✅ All good
Decision: Don’t ship yet, but investigate. You might be onto something bigger.
Maybe booking conversion isn’t the right primary KPI. Maybe the real value is in repeat behavior and satisfaction.
Scenario 5: Everything Moves Wrong
Primary KPI: ❌ Dropped to 62%
Secondary KPIs: ❌ Time-to-book increased, satisfaction down
Guardrails: ❌ Cancellations spiked to 9%
Decision: Kill the experiment immediately. Hypothesis was completely wrong.
How to Choose Your Metrics: A Framework
Step 1: Start with your North Star Ask: “What’s the ultimate goal of our product?”
Step 2: Work backward to Primary KPI Ask: “What’s the most direct way THIS experiment moves us toward the North Star?”
Step 3: Identify your hypothesis mechanisms Ask: “What intermediate changes must happen for the primary KPI to move?” These become Secondary KPIs.
Step 4: List everything that could break Ask: “What are all the ways this experiment could backfire?” These become Guardrails.
Step 5: Pressure test Ask: “If the Primary KPI doubles but Guardrail X breaks, would we ship this?” If the answer is no, your guardrail thresholds are wrong.
Metric Selection Checklist
Before running your experiment, verify:
North Star:
Is it the same for all experiments?
Does it measure value delivered?
Does it correlate with business health?
Primary KPI:
Is there only ONE?
Does it directly test the hypothesis?
Can it be measured accurately and quickly?
Is there a clear success threshold?
Secondary KPIs:
Do they explain HOW the primary KPI moved?
Do they cover different user segments?
Do they validate the hypothesis mechanisms?
Are there 3-7 of them (not too few, not too many)?
Guardrails:
Have we identified everything that could break?
Are thresholds clearly defined?
Are they measurable in the experiment timeframe?
Would we stop the experiment if they’re breached?
Key Takeaways
North Star = Your compass (one per company)
Primary KPI = Your target (one per experiment)
Secondary KPIs = Your diagnostic tools (3-7 per experiment)
Guardrails = Your safety nets (as many as needed)
A great experiment can fail in analysis if you chose the wrong metrics.
A mediocre experiment with perfect metrics teaches you more than a perfect experiment with bad metrics.
Choose wisely.